3. Pipeline Design
We are designing a robust, scalable pipeline suitable for large, transactional data that facilitates subsequent machine learning tasks.
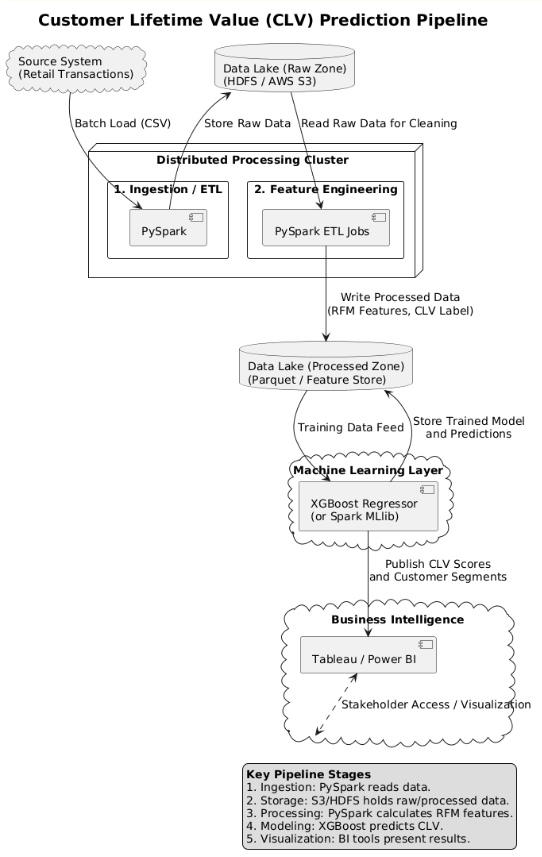
1. Data Ingestion
Batch processing using Apache Spark to load raw CSV files from HDFS or AWS S3 (distributed reading).
2. Storage Layer
Raw data in HDFS/S3 (Data Lake). Processed, aggregated data in Parquet columnar format for optimized reading speed.
3. Processing (ETL)
Distributed ETL using PySpark. Includes cleaning (removing missing IDs, negative values) and aggregating data to create RFM features.
4. Analytics & Modeling
Training regression models (primarily XGBoost Regressor) on feature-engineered data, with Linear Regression as a baseline.
5. Visualization Layer
Dashboards using Tableau or Power BI to present CLV predictions and customer segments for stakeholders.
Full Architectural Diagram is included in the Appendix of the PDF submission.